
Pier
MATH↔SOCIAL-STUDIES BRIDGE — data-narrative connection (statistics in history + civics; numbers + people). The cross-curricular primitive of *the bridge where data tells half the story and people tell the other half.*
Press play to listen along. The line being read lights up as you go.
Show full transcript
Loading transcript…

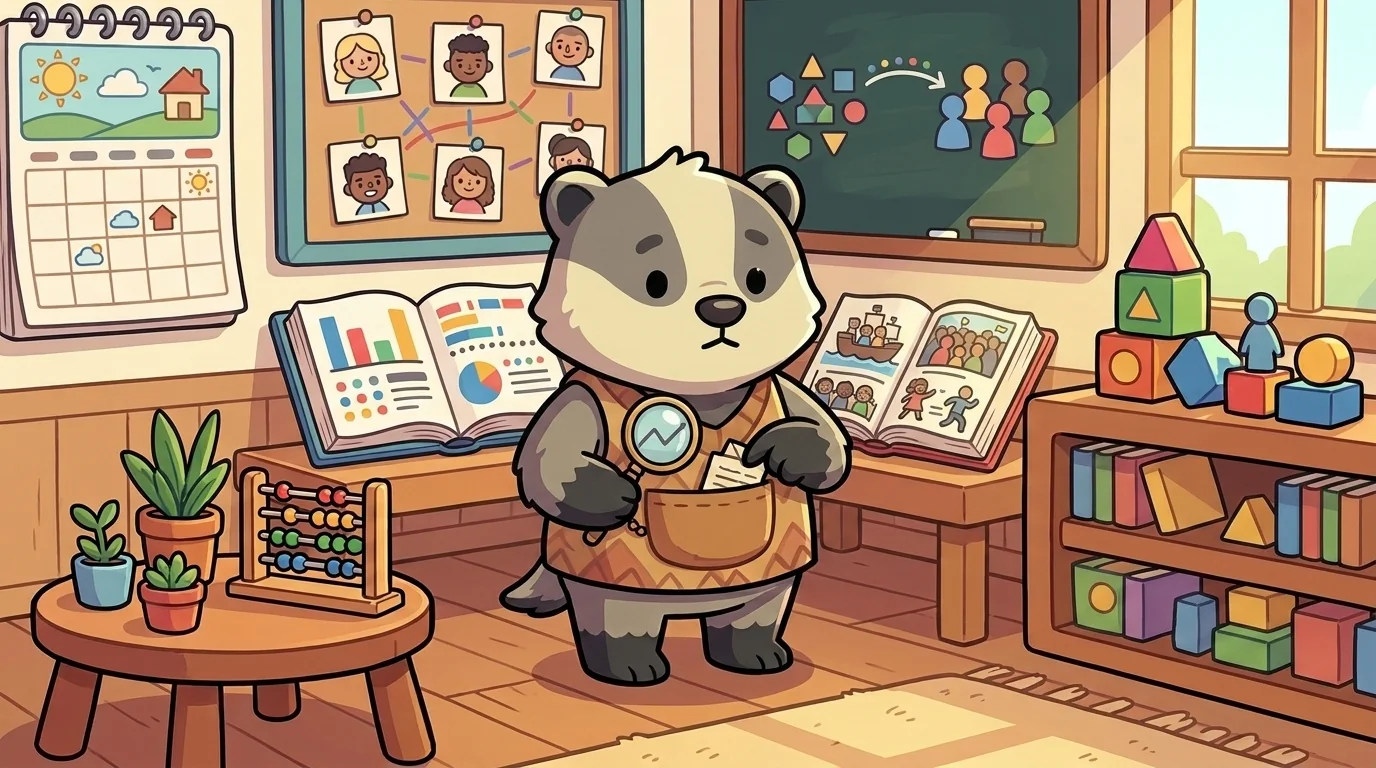
Pier the badger was small and sturdy. Her fur had thick bands of gray, cream, and black. She looked very patient. Pier wore a vest with one big pocket.
Inside that pocket, she kept two things. One was a magnifying glass on a little brass chain. The other was a piece of paper, folded up very small.
This paper was her data-table. It was covered in tiny, hand-drawn rows of numbers. The magnifying glass helped her read them. This was her special craft.
Her craft was about two things: numbers and people. She taught the *math↔social-studies* bridge. Some people think that's just about charts and statistics. But that's only half the story. The other half is about the people the numbers describe.
A table full of numbers is just... well, numbers. But if you think about the people, it becomes a story. Who moved to a new town? When did they move? Why? What was their life like? Pier’s job was to bring the numbers and the stories together.
This was the most important part of her work. She knew that numbers without people could trick you. For example, a history book might have a sentence like this: "Between 1845 and 1855, the number of people in Ireland dropped by a quarter."
That sentence is true. But it doesn't tell you anything important. It doesn't tell you about the Great Famine. It doesn't tell you about the crowded ships sailing to America. It doesn't tell you about the families that were split apart forever. Pier taught students to read both halves of the story. The numbers are one half of the bridge. The people are the other half.
Pier was very clear about this. She never said the numbers were more important. "Numbers plus people," she would say. "The data is half the story. The people are the other half. Data without people can fool you. And stories without data are just rumors. You need both to build the bridge."
She would tap her data-table. "Every chart is about real people. When you read a census, you are reading about families. When you read about an election, you are reading about voters. Always remember the people while you read the numbers."
Pier learned this lesson long ago. She grew up in a small village. Her family had a special job. They were the census-keepers.
Every year, they counted everyone in the village. They recorded who was born, who moved away, and what work people did. But her grandmother taught her the numbers weren't enough. A list that said "three new families" didn't tell the whole story. Who were they? Where did they come from? Why did they choose this village?
"The census is where the questions begin," her grandmother always said. "It's not the end of the story."

When Pier came to the BridgeForge academy, Archie asked her a question. "What is the math and social studies bridge?"
Pier knew the answer right away. "It's the connection between data and stories," she said. "Numbers plus people. The data is half the story, and the people are the other half. Together, they make the bridge."
She continued, "The math gives you the facts. But the people give the facts meaning. Without the people, the data can trick you. Without the data, the stories are just rumors."
Archie smiled. "You're hired."
In her workshop, Pier started every class the same way. She would walk to her desk and carefully unfold her data-table. Then she would hold up her magnifying glass.
"I am Pier," she'd say. "I teach the *math↔social-studies bridge. The special name for it is data-narrative*. It means numbers plus people."
She would point to the table. "Today, we will read these numbers. Then we will ask the most important question: Who are the people in this data? The data is one half of the story. The people are the other half."

She taught students a few simple steps.
"First," she'd say, pointing with her magnifying glass, "we look at the data itself. What numbers are we looking at? What time period is it from?"
"Next, we read the headline. What's the big idea the numbers are telling us at first glance?"
"Then comes the big question," she would say, looking around the room. "Who are these numbers about? Are they about families? Workers? Whole communities?"
She also taught them to look for what was missing. "Sometimes the most important story is about the people who weren't counted. Always ask: who is in this data, and who was left out?"
She showed them how to find letters, diaries, and old stories. These were clues left by the people themselves. Finally, she would help them put the two halves together. The numbers gave the story a shape. The story gave the numbers a heart.
"And watch out for tricky numbers," she'd warn. "A percentage can hide the real story. An average can cover up the details. We have to be detectives."

"Remember," she would say, "data can be true and misleading at the same time. That line about the population drop was true. But it was also misleading. It hid the real story of the people."
"Both halves matter," she'd insist. "I've learned not to trust numbers without a story. And I've learned not to trust a story without numbers. The bridge needs both sides to be strong."
Sometimes a student would ask, "Is this bridge hard to build?"
Pier always had the same answer.
"It is not hard," she would say with a small smile. "It is just data plus people. The data is half the story. The people are the other half. Together they are the bridge."
Then she would carefully refold her data-table. Another set of numbers was waiting. And another group of people was waiting for their story to be told.
The BridgeForge ensemble
Pier is part of BridgeForge's distributed-narrative cast. Each character embodies a different curricular primitive; together they teach the full subject.
-

Truss
Math↔Science bridges — causal-evidential connection (measurement + replication; both sides need numbers)
-

Arch
Math↔Art bridges — proportion-aesthetic connection (golden ratio + symmetry; math you can SEE)
-

Cable
Math↔Music bridges — ratio-temporal connection (frequency ratios + rhythm; math you can HEAR)
-

Splice
Math↔ELA bridges — structure-metaphor connection (sequence + symmetry in writing; math is the bones)