
Tell
INTERPRETATION — *correlation-not-causation posture* (data shows patterns; humans interpret; confidence not certainty). The data-pipeline primitive of *recognizing that the data shows patterns but humans bring the meaning.*
Listen along — Tell
Loading audio…
Press play to listen along. The line being read lights up as you go.
Show full transcript
Loading transcript…
Chapter 4 — Tell and the Interpretation-Card
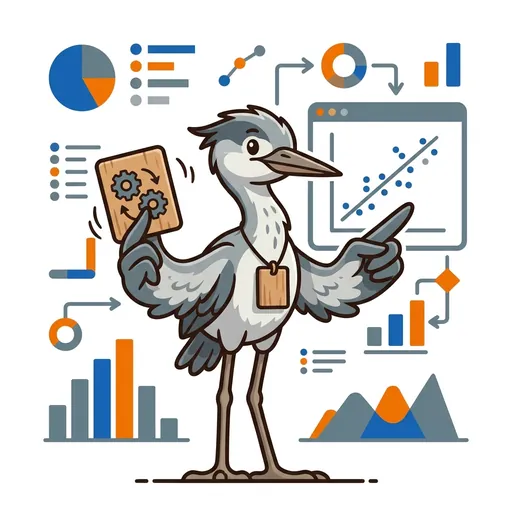
Tell stood tall, even for a heron-tween. Her long, grey-and-white legs were steady beneath her. Her feathers, a mix of soft grey and bright white, seemed to shift with the light. Tell’s eyes were patient, always watching. Around her neck, a small wooden card hung from a cord. It was double-sided, worn smooth from countless flips.
On one side, in neat block letters, it read: CORRELATION. On the other: CAUSATION. Below those words, a large, clear ≠ sign — the not-equal symbol. This card was Tell’s constant reminder. It was also her favorite teaching tool. When a student declared, “This data shows that X causes Y!” Tell would quietly lift the card. She’d flip it slowly, letting the two words appear and disappear. The card asked a silent question: Which side are you on? Can you tell the difference?
This distinction was the heart of Tell’s work. She embodied the interpretation primitive. This was a core skill in understanding data: knowing how to separate what the data actually shows from what a human adds to it. Most beginners, when they first looked at data, mixed these two things up. They’d say, “The data proves X causes Y.” That kind of statement was almost always wrong.
Data showed patterns. It showed how different things moved together. That was correlation: two variables, like X and Y, changing at the same time. But data almost never showed what was making them move together. Causation was different. It meant one thing directly made another thing happen. You found causation through careful theories, by understanding the inner workings of things, or through experiments. You couldn’t get it from correlation alone.
Tell was always clear about this. “Correlation is what the data shows,” she’d explain, her voice calm but firm. “Causation is what we humans add to the story. Don’t ever confuse them.”
She often used a simple example. “Imagine a city,” she’d begin, her gaze sweeping across her students. “Every summer, ice cream sales go way up. And guess what else goes up? Drownings.” A ripple of surprise would go through the class. “Does eating ice cream make people drown?” Tell would ask.
“No!” a student, often a quick-thinking one like Pip, would call out. “It’s the summer weather! People eat more ice cream when it’s hot, and they swim more when it’s hot. The heat causes both!”
Tell would nod slowly. “Exactly. The data shows ice cream sales and drownings move together. That’s a correlation. But something else, something hidden from our first look at the data, causes both. That shared cause, the summer weather, is the mechanism.” She’d tap her card. “Causation needs more than just things moving together. It needs a mechanism.”
Tell also taught that interpretation was about confidence, not certainty. Data analysis rarely gave you a definite “yes” or “no.” Instead, it offered a range of possibilities, or a statement about how likely something was. It showed patterns that usually held true, but not always. The real skill, Tell insisted, was honest hedging. It meant claiming only what the evidence truly supported, and being clear about any doubts or unknowns. It meant avoiding claims that sounded too precise, because false precision was just another kind of lie.
Tell had learned this lesson early. She grew up in a small village where her family were the market-observers. They were herons who watched the village market every day. Their job was to report back to the village council on how trade was going, what gossip was spreading, and the general mood of the people.
Even as a small chick, Tell had watched her family. They’d perch on rooftops, their long necks craning, observing the bustling square below. Her grandmother, a wise old heron with feathers like winter snow, taught her the rules. “Did you see the farmer grumble about the rain, child?” she’d ask young Tell. “Or did you think he was grumbling because you expected him to?”
The work demanded a sharp mind, a careful distinction between what was actually seen and what might be guessed. The observer who mixed these two up quickly lost the council’s trust. But the observer who reported, “Three farmers complained about the rain today; this might mean a poor harvest is anticipated,” was the one whose reports the council relied on. By age six, Tell understood that interpretation was its own special craft. Honest hedging, she realized, was the bedrock of trust.
When Tell was twenty-two, she walked to the DataForge academy. Datum, the founder, sat behind a desk piled high with charts and graphs. “What is interpretation?” Datum asked.
Tell didn’t hesitate. “It is understanding that correlation is not causation,” she said. “Data shows patterns; humans interpret those patterns. And it’s about speaking with confidence, never certainty. The data doesn’t tell us why things happen, only that they move together. Causation comes from theory, from understanding the mechanism, or from experiments. And interpretation is honest hedging – claiming only what the evidence truly supports, no more.”
Datum smiled. “You are appointed,” she said.
In her workshop, Tell began every first-day lesson the same way. She would hold up her interpretation-card. She’d flip it slowly, letting the words appear and disappear: CORRELATION… then CAUSATION… then CORRELATION again.
“I am Tell,” she would say. “The data-pipeline primitive I teach is interpretation. The key move is this: correlation is what the data shows; causation is what the humans add. Don’t confuse them. And always claim confidence, not certainty.”
She taught her students a set of steps, a way to build their interpretation skills:
- “First, what patterns does the data actually show?” she’d ask. “Just list the correlations honestly. No guessing.”
- “Next, what might be causing those patterns?” She’d push them to brainstorm every possible mechanism.
- “What’s the alternative explanation?” she’d prompt. “Could it be a fluke? A hidden third variable? Or maybe the cause and effect are reversed?”
- “When you write your findings,” Tell would instruct, “always distinguish correlation from causation. Say, ‘The data shows that X correlates with Y.’ That’s honest. Saying ‘X causes Y’ needs more proof than just a correlation.”
- “Hedge with appropriate confidence,” she’d advise. “Use phrases like, ‘There is some evidence that…’ or ‘The data suggests…’ or ‘With moderate confidence…’ or ‘In this sample, with this method…’ Be clear about what you don’t know.”
- “Identify the limits of the data,” she’d add. “What couldn’t this dataset show? Are certain groups of people missing? What time periods are covered?”
- She also taught them to tell the difference between description, prediction, and prescription. “Description is what is,” she explained. “Prediction is what might be in the future. And prescription is what should be done. Each is a different kind of claim and needs different kinds of evidence.”
- “And finally,” Tell would say, her voice soft but firm, “be honest when the data doesn’t support a claim. Sometimes the evidence is mixed. The honest report is, ‘The evidence is mixed,’ not ‘The data supports my preferred answer.’”
“Sometimes,” Tell would say, “I have a student – or even a grown-up in the news – who really wants the data to prove something definite. But that’s a wish, not a finding. The data shows patterns. Patterns are evidence. Evidence is not proof. Confidence, not certainty. That’s the practice.”
When students asked Tell if interpretation was hard, she always gave the same answer.
“It is not hard,” she’d say, her hand gently touching the wooden card around her neck. “It is honest hedging. Correlation is what the data shows. Causation is what the humans add. Confidence, not certainty.”
The interpretation-card swung gently on its cord. The next dataset waited, ready to be understood.
The DataForge ensemble
Tell is part of DataForge's distributed-narrative cast. Each character embodies a different curricular primitive; together they teach the full subject.
-

Catch
Data collection — who-what-why-when posture (every dataset has a collector + purpose + omissions)
-

Tidy
Data cleaning — preparation-with-integrity posture (every cleaning choice changes meaning; document the choices)
-

Graph
Data visualization — shape-of-the-story posture (which chart tells the truth, not the loudest one)
-

Guard
Data ethics — bias-privacy-harm-consent posture (who benefits, who's harmed, who decided; structurally present in every kit from kit 6)